Creating Development Types
This section deals with basic setup and calibration of the Envision Tomorrow Scenario Builder spreadsheet. The ET Scenario Builder spreadsheet is the central exchange point for demographic, financial, building, and place type assumptions within Envision Tomorrow. Not only does the spatial Scenario Painter add-in for ArcGIS rely on this spreadsheet, but other stand-alone models rely on its ouputs as well. Building Prototypes also play a major role in the Scenario Builder spreadsheet as they form the basis for building assumptions and are dynamically linked within the spreadsheet interface.
The Envision Tomorrow Scenario Builder spreadsheet consists of color-coded tabs, some of which will be discussed in this section. For a more detailed discussion of the Scenario Builder spreadsheet, read the section on advanced calibration. For the purposes of this basic guide, users should pay attention to five main tabs:
- Quick Start Guide
- Project Info
- Building Inputs
- Dev Type Streets
- Dev Type Building Mix
Quick Start Guide
The "Quick Start Guide" tab presents the user with a general overview of the Envision Tomorrow Scenario Builder spreadsheet and lists the version and when the model was last updated.
Like many Envision Tomorrow spreadsheets, the Scenario Builder spreadsheet consists of three tab types color coded by function – 1. input tabs (pink), 2. output tabs (blue), and 3. reference tabs (light blue).


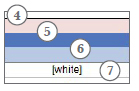
The Scenario Builder cells are also color-coordinated to reference 4. input, 5. header, 6. subheader and 7. output cells.
Project Info
The "Project Info" tab stores important location-specific demographic and financial info about your study area. For more information about calibrating the "Project Info" tab, refer to the advanced calibration section.
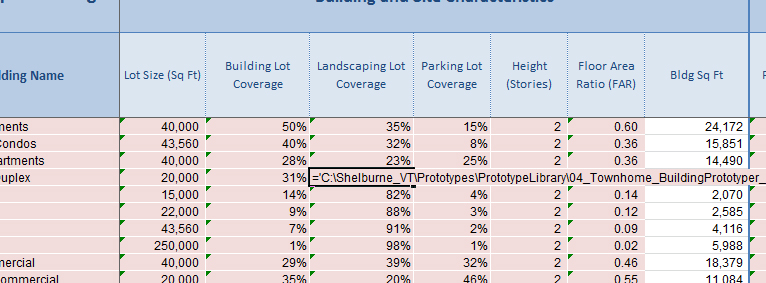
Building Inputs
The "Building Inputs" tab is where information from your building prototype library is referenced. For more information about building prototypes and creating a prototype library, refer to the building prototype section.
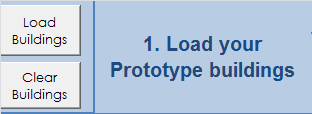
- Load Buildings Macro: Click the macro button titled "Load Buildings".
- Select Prototypes: This will bring up a file browser window through which the user will be prompted to locate the building prototypes they would like to load into the Scenario Builder spreadsheet. By holding the CNTRL+ key, and clicking on individual Bulding Prototype spreadsheets, it is possible to select multiple prototypes at once for batch processing.
- Notice that the pink cells in the "Building Inputs" tab are now linked to individual Buliding Prototype spreadsheets.
Note: The "Clear Buildings" macro is useful for removing remnant data from the spreadsheet. Beware that there is no way to "undo" once you have clicked the "Clear Buildings" button.
Note: When ET loads buildings into the Scenairo Builder spreadsheet, it will do so line by line, starting with the first line in this tab. That means that adding additional buildings in a piecemeal fasion will result in overwriting building entries already in the spreadsheet. It is recommended that you load all your buildings in at once.
Dev Type Streets
The "Dev Type Streets" tab is where users define development type names and a range of attributes that relate to the urban form of development types. It is important to understand that a major assumption within ET is that new streets, infrastructure, parks, etc. need only be applied to new development when it is being "painted" on vacant land. Development on existing developed land (redevelopment) is assumed to require no additional infrastructure.
There are six main assumptions for greenfield development being addressed in the "Dev Type Streets" tab.

- Development Type Names: Start by entering a list of development type names in column A. These could relate to individual building types, all the way up to place types that mimic entire neighborhoods. Enter up to 100 development types
- Block Size:Enter the length of each typical block face for each development. ET automatically calculates block areas.
- Right-of-Way: Enter the number of lanes and lane width. ET automatically calculates the auto-dedicated right-of-way
- Streetscape: Enter the width of sidewalks, landscaping, parking, and bike lane assumptions. For streetscape attributes such as parking, sidewalks, and bike lanes, the user is expected to enter width for one side of the street which ET will then double. The only exception to this is landscaping which should equal the total for both sides of the street.
- Connectivity: define the percent of cul-de-sacs within each development type
- Parks and Civic spaces: define the percent of each development type that should be dedicated to parks and civic spaces when vacant land is consumed.
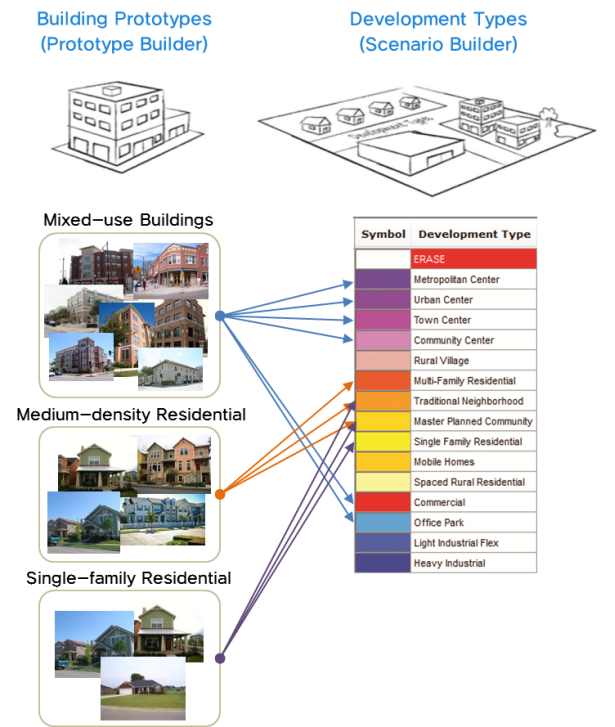
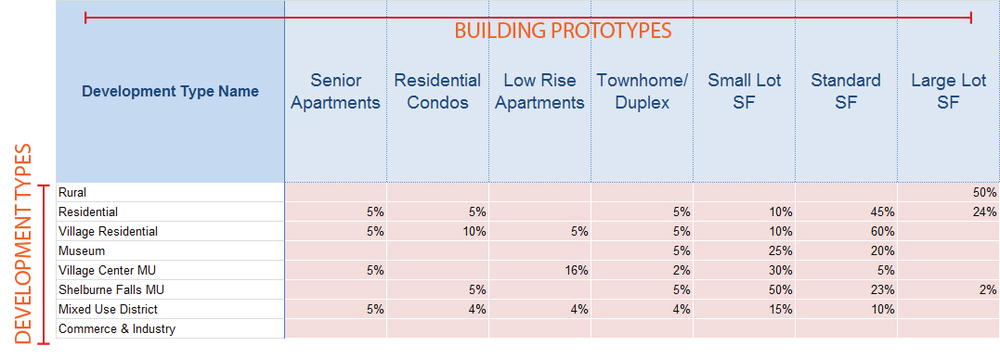
Dev Type Building Mix
The final tab required for basic calibration is the "Dev Type Building Mix" tab. This tab allows users to combine various building prototypes together to create development types. As development types are created, users can track the densities and other basic metrics.
Filling out the Development Type Matrix
The development type matrix is the area of pink cells formed by a list of buliding types along the horizontal axis and development types along the vertical axis. The general workflow for this step is to go through, development type by development type, and fill in percentages under appropriate buildings. The "Building Check" column provides guidance on whether each row sums to 100%.
Note: Rows do not necessarily have to sum to 100%. Some users find it necessary to create an "Open Space" development type which would consist of 100% parks and no buildings.
Redevelopment Rate
The redevelopment rate is an important concept to understand when creating development types. When painting over large swaths of land in Envision Tomorrow, it is helpful to have a scale factor when dealing with painting on developed land. Especially at the regional scale, we want to be able to freely apply development types without worrying about overstating the amount of redevelopment in our scenario. The redevelopment rate allows us to scale redevelopment back by only calculating a percentage of new development on developed land based on this redevelopment rate.
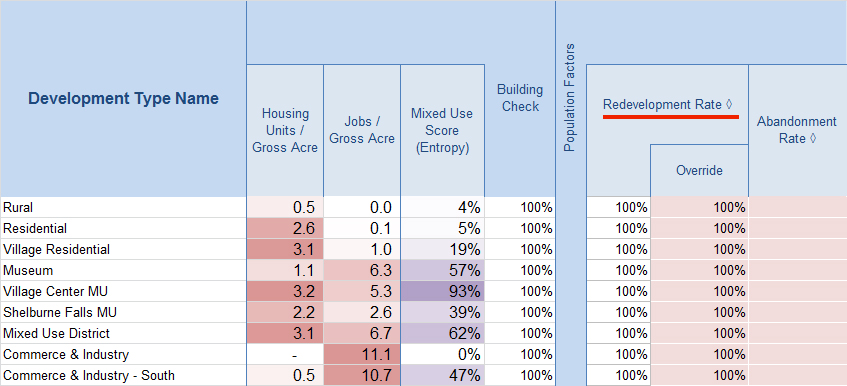
Typically, higher value or higher intensity development types will have higher redevelopment rates. ET provides some guidance in this area by estimating redevelopment rate based on average project value per acre. An override field allows users to fine-tune this assumption.
Note: In some instances it is valid to have a 100% redevelopment rate. Especially at smaller scales, where planners can be more intentional about individual properties redeveloping, 100% redevelopment rate may be appropriate.
Abandonment Rate
The abandonment rate factor allows users to represent population decline and housing unit abandonment in their scenario. Users can create a development type devoid of new buildings that contains only an abandonment rate. For instance, a blank development type with a 30% abandonment rate would remove 30% of all housing units, people, and jobs in an area.
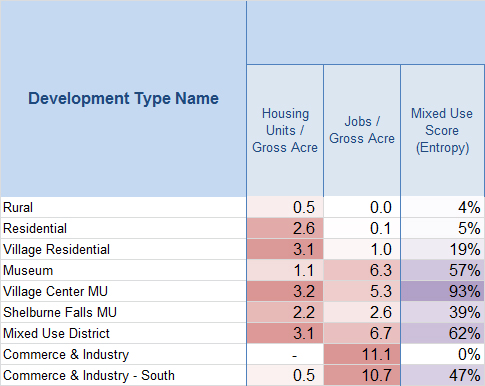
Basic Metrics
While experimenting with different combinations of buildings, users can view basic built environment metrics on the "Dev Type Building Mix" tab. Expand the columns on the left side of the tab to view housing unit, population, and jobs density as well as a mixed use or "entropy score".