
Using the Prototype Builder
The Prototype Builder is a versatile, easy-to-use spreadsheet tool that is used to test the physical and financial feasibility of proposed development and to better understand the effects of existing and/or proposed development regulations. The Prototype Builder considers a range of factors including parking requirements, height and use requirements, fees, rents, subsidies, and construction costs. The Prototype Builder then works to create a spectrum of feasible prototype buildings for a specific place.
Planners and policy-makers use the Prototype Builder in a number of ways, ranging from a site-specific to neighborhood scale. It can be used as a stand-alone tool or in conjunction with the Envision Tomorrow Scenario Builder. As a stand-alone tool, the model can help to compare options for future infrastructure or amenities investments in different areas of a city to increase housing affordability. The model can also evaluate the effects of specific regulations, like parking or height requirements, on the feasibility of desired development. Or, by using a various mix of single-use and mixed-use building prototypes, it can be used to understand and evaluate the implications of different styles of development.

Quick Start Guide
Like many Envision Tomorrow spreadsheets, the Prototype Builder spreadsheet consists of three tab types color coded by function – 1. input tabs (pink), 2. output tabs (blue), and 3. reference tabs (light blue).


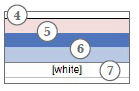
The Prototype Builder cells are also color-coordinated to reference 4. input, 5. header, 6. subheader and 7. output cells.
Tabs in the Prototype Builder spreadsheet can be grouped into five major categories based on theme functions of each tab:
- Physical Inputs
- Financial Inputs (Basic/Advanced/Gap Financing)
- Input Calculators
- Summary Tabs
- Pro Forma Tabs
- Advanced Modules (Green Infrastructure/Trip Generation/ROI Scenario)
For basic model calibration and prototyping, users need only adjust data on the Physical Inputs and Basic Financial tabs. Other tabs are populated with generic national-average data that can be adjusted if the user desires a more fine-tuned prototype model.

Physical Inputs
The “Physical Inputs” Tabs allow users to set the parameters that guide the building envelope of your prototype building. These tabs require baseline information such as site area, building uses, building form, parking requirements, open space, and so on. Also, some building or zoning regulations such as building heights, setbacks, and parking requirements should be considered.
A brief note about the dashboard that exists on the top of the Physical Inputs tab. This dashboard presents some key physical and financial variables of your prototype building. This helps facilitate an iterative process of checking and re-checking building attributes as you fine-tune your prototype. This dashboard is visble on the Physical Inputs, Physical Outputs, Basic Financial, and Advanced Financial Tabs. All input data entered in the physical tabs help update information in the prototype summary dashboard. The before tax leveraged internal rate of return (IRR) is the annual effective compounded rate of return which can be earned on the invested capital for a project with rental space (in other words, IRR is a way to measure the yield on an investment). Target IRR for new development: 12-15%

Project Info
The Project Info section provides user inputs for the project name and location. These inputs are optional and used only to track the prototype name in other Envision Tomorrow modules.
Site Inputs
The site inputs table is where users enter key site parameters. These include:

- Building name: The name entered here will be used on the printed summary sheet.
- Project city/state: This is the name of the city or region where the prototype is being used. The name entered here will be used on the print summary sheet.
- Site area: The size of the lot, in square feet, that you are testing. You can either input 43,560 to test the building on a per acre basis OR enter the actual lot size to test a specific site.
- Site net-to-gross ratio: This is the ratio of the total area of land on a site (the gross square footage) to the total area minus any common areas (the net square footage). Use 100% if you are looking at a single parcel or small site.
- Landscaping or open space: The percentage of landscaping or open space in the project. This input can also be used to account for required setbacks. This is an example of an input where you can test the existing or proposed regulations.
- Building height (stories): The height, in stories, of the building.
- Under-build: This input allows you to take building design into account. Assuming 100% underbuild means that the building volume is maxed out. By reducing the underbuild, you account for design features such as stepbacks or patios.

Building Uses and Densities
The Prototype Builder spreadsheet allows users to calibrate average housing unit and employment densities while defining the types of uses within a particular protype as follows:

- Building uses: The percentage of the building square footage by use. The percentages must add to 100%. Buildings may be single-use or mixed-use. Public uses may include civic buildings, schools, etc. You will have the opportunity to define the assumptions for each of the uses in the Prototype Builder’s parking and financial tabs.
- Owner or renter occupied: If you choose to include residential uses in your building prototype, then you can select which type of building you want to model. If there is no residential, just select “none” in the blank.
- Average residential unit size: the average unit size of the market-rate residential and/or affordable residential units in square feet.
- Average square foot per employee: For non-residential uses, this is the average gross square footage per employee for retail, office, industrial, public, and other uses.
Parking
How much parking is required and how it is accomodated on the site have a major impact in overall site design. Use the following tables to specify parking ratios and styles as follows:


- Parking spaces per dwelling unit or 1,000 square feet of non-residential use: The number of parking spaces allocated to each use in the prototype building.
- Surface or structured parking: The number of levels of above ground parking. If there is only surface parking, it should equal 1. If there is structured parking, this should be more than 1.
- Internal parking (tuck under or sandwich/podium): If you would like to include internal parking within the building envelope, such as tuck under or sandwich/podium parking, this input allows you to designate how many full or partial levels of the building would be internal parking. For example, if you wanted to test 1/2 of the ground floor as tuck-under, you would enter 0.5.
- Underground parking: This input is the maximum number of levels that you could feasibly build on the site. Depending on your parking requirements, you may not need to build that many levels. The “check” to the right of the input shows how many levels of underground parking you would need in order to maximize development on the site. The output below shows how many actual levels are required based on your maximum levels assumption and your underbuild assumption.
- Parking layout: The area per parking space including entry, exit and circulation in square feet. Depending on the efficiency of your site, this can range from 250-400 square feet per parking space.
- Selection: By placing an X in one of the five boxes, you are choosing which assumption to make for average parking space size (including circulation, etc.)
- Custom size: If choosing a “custom” configuration, please enter an average space size assumption in square feet.
Physical Outputs
The Physical Outputs tab allows users to see additional details about the building form specified in the Physical Inputs tab.
Site and Land Use Outputs
- Square footage by use: Note: The net square footage can be adjusted in the financial tab.
- Total dwelling units: The number of housing units for the market-rate and affordable components of the building.
- Total jobs: The estimated number of jobs by each non-residential use.
Parking Outputs

- Required spaces per 1,000 sq ft of development or useable building: The number of spaces required for every 1,000 square feet of development, averaged across all uses in the building.
- Spaces required by land use: The total number of parking spaces required by building use.
- Parking area (sq ft): The parking area (in square feet) for each use. The parking area is based on the average space size entered in “parking space size.”
- Allocation of parking spaces by type: This shows how the parking need is met, based on the previous assumptions.
Basic Financial
The basic financial tab gives you the flexibility to make assumptions for costs and revenues for your prototype building. You can test the impacts of financial changes to the financial feasibility of developing your building.
Land and Construction Costs
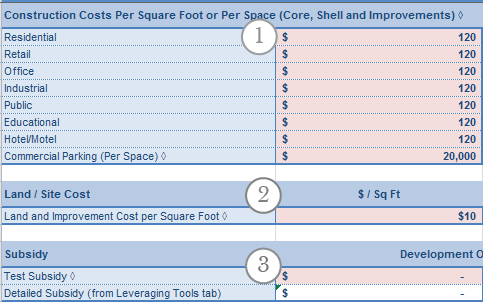
- Construction costs per square foot (core, shell and improvements): The construction costs per square foot including core, shell and tenant improvements. Does not include parking. (These costs are covered below under “parking costs.”) Depending on use and level of finish, these costs could range from under $90 to $200+ per square foot.
- Acquisition costs: The cost of acquiring the land and any improvements on the land (i.e. buildings). The total land cost is an input and the output to the right shows the cost per square foot. Recent sales of comparable buildings can help you estimate land value.
- Subsidy: An input for any subsidy which may be put into a project. The output to the right shows the per square foot subsidy, if applicable.
Affordable Rent Target

- Area Median Income (AMI): The median household income in the study area / market area
- Percent of AMI : The percent of AMI upon which "affordable" rent will be based. This assumption uses HUD's 30% guideline for monthly housing costs. For instance, if AMI is $60,000 and the % of AMI for affordability is set at 80%, then the maximum affordable monthly rent is (($60,000 x 80%)/12)*30% or $1,200.
Rental Rates, Lease Rates, and Sales Prices

- Residential: The monthly rent per square foot for a residential unit. For example: a 2-bedroom, 1,000 sq ft apartment at $1.50/sq ft = $1,500/month.
- Parking Fee: If parking is de-coupled from monthly rent, you can enter a separate monthly fee for it in this cell.
- Residential: For condominiums or for-sale residential properties, the sales price per square foot. For example: a 2-bedroom, 1,200 sq ft condo at $374/sq ft = $448,800.
- Non-residential: The annual triple net rent per square foot for commercial or public uses. For example: a 1,000 sq ft commercial space at $19.50/sq ft = $1,625/month.
Parking Costs

- Parking costs: The average costs to construct a parking space by type. Surface parking is the least expensive option, though the trade-off is that more of the parcel is devoted to parking. On the other end of the spectrum, underground parking is the most expensive type of parking, but also allows to maximum development of a site.
Basic Financial Outputs
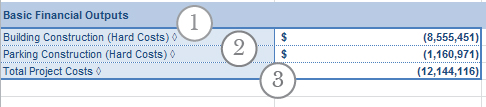
- Building construction costs: The hard construction costs for the building you are modeling.
- Parking construction costs: The costs of parking construction for the project.
- Total costs: The combined acquisition, hard and soft costs of the development
Input Calculators
The Prototype Bulider often calls for "blended averages" for certain inputs. One example of this is the average unit size for the development. Residential buildings often contain a range of different sized units, but the model calls for a simple weighted average. The "Input Calculators" tab allows users to make nuanced calculations for the blended averages that the Prototype Builder often calls for. None of the cells in this tab are used directly within the model. Rather, it is up to the user to manually apply the outputs of various calculation tables into the appropriate input tabs in the model.
FAR, Density, and Landscaping

- This is simply a check for FAR and density thresholds that may exist in some local zoning codes. Enter the maximum density and FAR as mandated in your code to see if the model exceeds these allowances
- Zoning often mandates certain setbacks, particularly for single-family bulidings. The Prototype Builder, on the other hand, does not use setbacks as a physical input, but rather landscaping percentage. This input calculator table allows the user to back into the appropriate landscaping requirements based on setback requirements.
- Apply Landscaping %: use this macro button to apply the outputs of this table to the appropriate model input cells.
Unit Size Estimator

- Unit sizes: enter the sizes for different unit types
- Unit blend: enter the percentage of each type of unit within the building. This will produce a blended average unit size which is an input on the physical inputs tab.
- Parking requirement: enter the specific parking ratio for each unit type to calculate a blended average for the entire development. This is can be an input into the parking ratios physical input.
- Apply Unit Size: use this macro button to automatically apply the outputs of this table into the appropriate model inputs.
Residential Rent Estimator

- Rent by Unit Type: enter the approximate monthly rent per square foot
- Parking/mo: Enter the de-coupled parking fee per month associated with each unit type. Omit if parking is included in rental rate.
- Apply residential rent: use this macro button to apply the outputs of this table to the appropriate input cells.
Advanced Financial
The advanced financial tab allows you to make additional, more-detailed assumptions about the financial characteristics of your development. These range from building efficiency to permit fees and demolition costs to loan terms.
Building Efficiency and Occupancy Rate
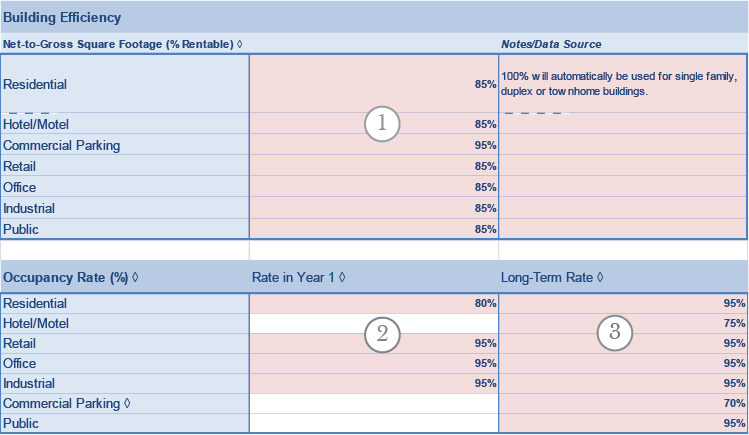
- Building Efficiency: the percent of leasable space within the development by use type. Unleasable space may include atriums, cafeterias, or hallways.
- Occupancy Rate (Year 1): the occupancy rate during the initial lease-up period. This is often less than the prevailing occupancy rate.
- The long-term or prevailing occupancy rate.
Soft Costs
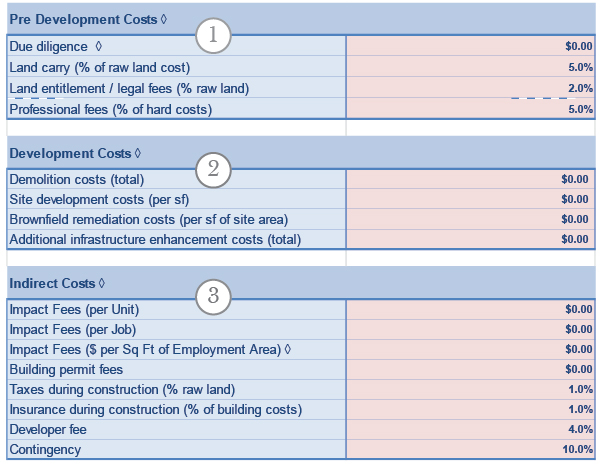
- Pre-Development Costs: these are fees associated with the preparation and due diligence of site acquisition.
- Development Costs: expenditures related with the preparation of land for development. These costs are treated as one-time lump sum costs.
- Indirect costs: these include impact fees or system development charges (SDCs), building permit fees, pre-development taxes, professional fees, and a hold for contingency.
Property Taxes

- Property Tax Rate: reported as a percentage of total project value (market value).
- Assessment Ratio: local taxing authorities often tax less than the fair market value of real estate. The assessment ratio allows users to scale back property tax rates based on market value to reflect local assessed values.
Financial Targets

- Financial targets (non-owner): these targets do not directly impact model outputs. Rather they act as benchmarks or targets upon which to base a reasonable rate of return for a given project
- Financial targets (owner): Same as above but tailored specifically to residential owner product.
Financial Assumptions
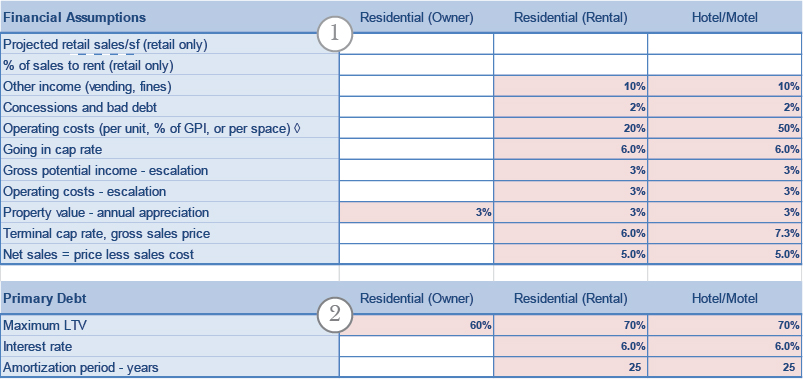
- Financial Assumptions: users can make separate financial assumptions for each use type within a development. These include cap rates, operating costs, gross potential income (GPI) and others which may have a significant impact on project value. These are populated with generic national values.
- Primary debt: these assumptions define the terms of the loan and debt service within each use pro forma.
Gap Financing
The "Gap Financing Options" tab allows users to test a range of different gap financing tools and how they impact the feasibility of a given project. These tools include:
- Property Tax Abatement
- Sales Tax Abatement
- Loan Support
- TIF
- Cashflow Support
- Fee Waivers
- Grants
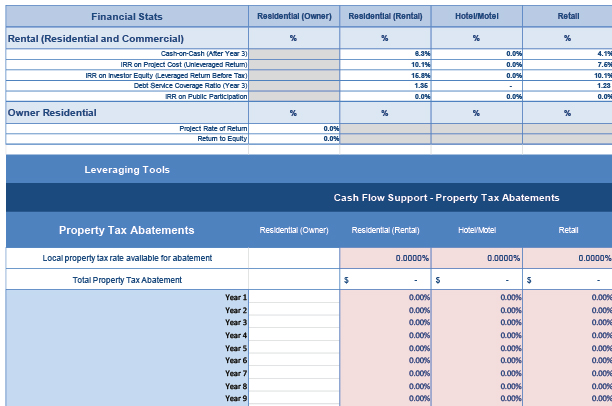
A full list of gap financing tools and their definitions can be found on the "Gap Financing Definitions" tab or in the glossary.
ROI Scenario
The "ROI Scenario" tab allows users to perform rent sensitivity tests on different aspects of their project. Test how varying land prices, parking requirements, or impact fees impact the feasibility of a given project using this tool.


- First, select the sensitivity test: users can choose from residual land value, impact fee (SDC), and parking ratio sensitivity tests. For instance, if a user chooses residual land value, a range of land values will be tested on the project to see how corresponding rental/lease/sales rates would fluctuate in order to meet a given return.
- Select product type: this list is populated based on the available product types within the project. A user can choose which product type to perform the sensitivity test on.

- Sensitivity test values: depending on the test chosen by the user, this table will dynamically
- display the correct input variable which must then be populated by the user. For example: if residual land value is selected, the table will display "Land Value / Lot Area Square Foot" prompting the user to enter a range of land values into the six sample rows.

- Rental Rate Function: This is the equation which defines the rent sensitivity curve. Using this formula, users can derive both the maximum land cost a development can carry, but also the rents required to carry a given land cost.
- Sensitivity Test Calculator: using the function above, users can enter a target rental/lease/sales rate to find the maximum sensitivity test value possible.
- Required Rental/Lease/Sales Rate Calculator: users can enter a sensitivity test value (land value, SDC, parking ratio) and find the rental/lease/sales rate required to carry that value.
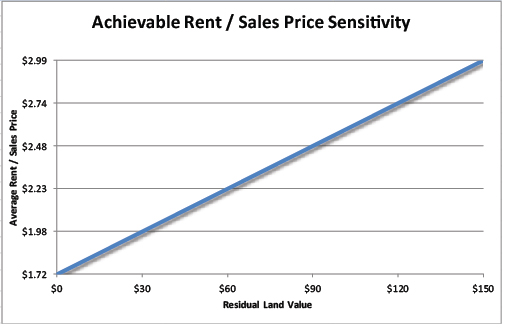
The rent sensitivity curve above changes dynamically based on user input. Users must click on the "Run Scenario" macro button in order to apply their settings.
Green Infrastucture
The Green Infrastructure App is integrated into both the Envision Tomorrow Prototype Builder and the Scenario Builder. The Green Infrastructure tab in the Prototype Builder uses information calculated or input elsewhere in the Prototype Builder to estimate water volumes, the size of water quality controls, and the expected amount of runoff pollutants. Required water quality volumes are based on the expected impervious cover. Users have the option to use preset buttons that select and size controls given the building footprint, landscaping area, and parking area calculated by the Prototype Builder. These controls include:
- green roofs
- green roofs connected to a cistern
- biofiltration facilities
- rain gardens
- conventional sedimentation-sand filters
For more information about the Green Infrastructure App, including a detailed user manual, click here.
Trip Generation
To help provide communities with better tools to analyze new development, EPA, in cooperation with ITE, worked with leading researchers and practitioners to develop new data and methods to estimate the trip-generation impacts of mixed-use developments. EPA analyzed six metropolitan regions, merging data from household travel surveys, GIS databases, and other sources to create consistent land use and travel measures. The resulting linked models estimate internal capture of trips within mixed-use developments as well as walking and transit use for trips starting or ending in mixed-use developments.
These models have recently been integrated into the Envision Tomorrow ROI model allowing for rapid site-level assessment of both ITE and MXD trip generation. For more information about the Site-Level MXD model within the Envision Tomorrow Prototype Builder, click here.
Pro Forma and Calculation Tabs
The other tabs in the model are the pro forma and building envelope calculators that drive the model. All of the formulas and calculations behind the model are shown in the spreadsheet, so you can see exactly how it works. The calculation tabs include:
- Scenario spreadsheet
- Rental pro formas
- Commercial pro formas
- Owner pro formas
- Building envelope calculator
The pro forma tabs all follow similar logic wherein gross potential income, operating costs, and construction costs are calculated and, except for residential owner product types, annualized over a 10-year hold period.
Print Summary

You can customize the print summary to show just the inputs and outputs that are important to your project. The default print summary includes some basic details. This page is not password-protected, so you can change the names and link to elsewhere in the model as you would like. There is also a blank area which you can use to post a photo of the site or rendering of the potential prototype building.