
The City / Regional Travel Model
What does it do?
When travel impacts are needed for an area larger than a district level, then the City or Regional Travel Model can be used. The model requires more input variables across a larger area, so preparing the data can be time consuming. However, the Envision Tomorrow tool library includes several wizards automate the processing of several steps.
6 Steps
1. Prepare Scenario Layer
The scenario layer needs to include several attributes for both the existing development as well as the new development added in the scenario painting process. In addition to the standard set of "EX_..." fields that should be included in the scenario layer (discussed here), 4 other fields are required for running the Travel Model. These additional household-related fields should only be populated for features that have households in them. Features without households should have a value of 0 for these extra variables. Values can be obtained from the Census at the Block Group level and disaggregated to your scenario geometry.
- Existing Households: EX_HH
- Existing Average Household Size: EX_AVG_HH_SIZE
- Existing Average Household Income: EX_AVG_HH_INC
- Existing Average Workers per Household: EX_AVG_HH_WORKERS

In addition to any fields the user may wish to aggregate, several attributes need to be enabled for "tracking" and written to the scenario layer using the Attribute Manager window.
- HH
- HU
- EMP
- POP
- AVG_HH_SIZE
- AVG_HH_INCOME
- AVG_HH_WORKERS
Once the user has these fields enabled for "tracking," a full sync should be performed to ensure the attribute fields are present and also calculate the values into the attribute table itself. Tip: use the "Travel Behavior" quick reference field grouping to automatically track all of the fields needed for the City/Regional travel model.
Manage which Attributes are Written to Scenario Layer
2. Aggregate to Neighborhood
Scenario layers are often parcel boundaries, or some other fine grained geometry. Running a complex model on large datasets can add significant processing time. In order to reduce the number of data points (or geometries) that require processing, Envision Tomorrow includes a "Scenario Aggregation" tool that allows users to summarize detailed scenario data to larger polygons, such as TAZ boundaries or Census Blocks.
The Scenario Aggregator wizard allows users to define which the attributes they would like to summarize. Only attributes that have been turned ON in the Attribute Manager for "tracking" are available for aggregation. To perform correctly, each attribute should have both an existing field (EX_ field) and development type related field included in the scenario layer. For instance, if the user would like to aggregate housing units, then the scenario layer needs to include both the EX_HU and HU fields.
The Scenario Aggregator can perform several types of aggregation. Since there are 4 types of Development Type attributes, there are 4 methods for aggregating these variables.
Learn more about how the Neighborhood Aggregator summarizes scenario data here.
File Menu Location
Scenario Aggregator Window
3. PREPARE SERVICE AREAS
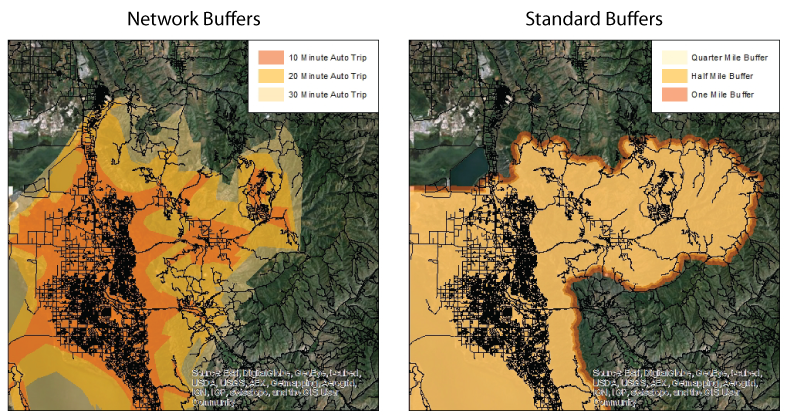
Several of the input variables rely on travel buffers (called service areas) in order to calculate. Each of the neighborhood boundaries requires seven different service area boundaries. The boundaries range from a quarter mile around the neighborhood to a boundary that represents a 30 minute drive. The service area boundaries are used to select and summarize underlying data back to the originating neighborhood feature.
| Service Area Descriptions | GIS Feature Name |
|---|---|
| 30 Minutes by Transit | SA_30_MINUTE_TRANSIT |
| 30 Minutes by Auto | SA_30_MINUTE_AUTO |
| 20 Minutes by Auto | SA_20_MINUTE_AUTO |
| 10 Minutes by Auto | SA_10_MINUTE_AUTO |
| One Mile | SA_ONE_MILE |
| Half Mile | SA_HALF_MILE |
| Quarter Mile | SA_QUARTER_MILE |
Calculating the service areas requires ESRI's Network Analyst and can be time consuming depending on the size of the scenario area. Envision Tomorrow includes a wizard that helps simplify the process, but processing can still take several hours.
Transportation Location Summary WizardThe ET Service Area buffer wizard window simplifies the process of using Network Analyst by only focusing on the key variables needed to run the 7D model. The user will need to define if they wish to create "standard" or "network" buffers. Standard buffers are simply simple, "crow fly" distance buffers around the neighborhood boundaries. The network buffers use a routable network to calculate more precise service area boundaries.
Those familiar with using Network Analyst may find it easier to create the service areas using the standard set of ESRI operations. Ultimately, individual feature classes with the names detailed above should be created and stored in a Geodatabase for use in steps below. Each of the features should also have an attribute field ID that matches the unique ID in the neighborhood layer. For more detailed instructions on using Network Analyst to create service areas, read this article.
4. Transportation Location Summary
Transportation characteristics, such as intersection density, transit stop density and regional accessibility, are key input variables to the travel model. Envision Tomorrow includes a Transportation Location Summary wizard that allows users to define input layers and calculate the necessary input values automatically.
The transportation summaries are performed on the neighborhood boundary file, not on the scenario layer. Several variables are calculated, and several are calculated for each of the buffer distances. As a result, processing a large file can take an hour or more.
5. Land Use Mix Calculation
The mix of land uses within and around each neighborhood boundary is an important variable for the Travel Model. The more varied the land uses a resident has easy and close access to, the less likely they are to drive out of their neighborhood area to go to work or find basic goods and services, and the more likely they are to walk or bike.
Land Use Mix Wizard WindowET has a wizard that calculates the land use mix for the various buffer distances around each neighborhood boundary. After opening the Land Use Mix wizard window, the user is required to identify the neighborhood boundary layer, the unique ID shared with the service area buffers, and also identify the service area geodatabase. Once those variables are established, the user clicks Run and the wizard calculates all of the land use mixes into the attribute table of the neighborhood boundary feature.
6. Final 7D Model Calculations
You now have all of the necessary inputs to run the 7D Model predictive equations, which result in neighborhood-level predictions of several daily, household-level travel metrics:
- Vehicle Miles Traveled (VMT)
- Auto Trips
- Transit Trips
- Bike Trips
- Walk Trips
The calculation wizard window requires the user to indicate if they are calculating the travel outcomes for the existing development (ie- the EX_ fields) or if they are calculating the total development (existing plus newly painted scenario development). The user should also use the wizard window to select the stand-alone Household 7D Model spreadsheet they wish to use.